
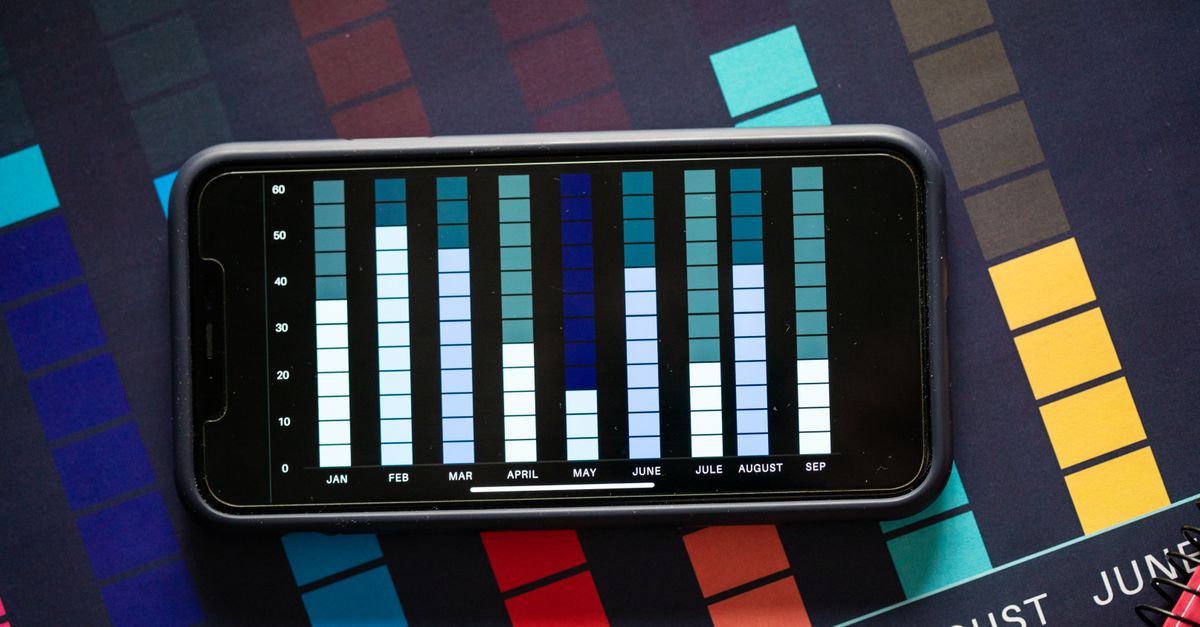
An In-App Purchases Report is a comprehensive document that details the financial performance and user behavior related to purchases made within a mobile application. This report typically includes data on revenue generated, the frequency of purchases, user demographics, and trends over time. It serves as a crucial tool for app developers and marketers to understand the monetization effectiveness of their in-app offerings.
The report provides deep insights into how users interact with in-app purchase options, highlighting which products or features are most popular and identifying opportunities for optimization. By analyzing metrics such as average order value, purchase frequency, and user retention rates, businesses can tailor their pricing strategies and promotional campaigns to maximize revenue. This level of granularity allows for strategic adjustments that enhance both user satisfaction and overall profitability.
Furthermore, an In-App Purchases Report is essential for monitoring the health of an app’s monetization model. It helps stakeholders identify potential issues such as declining purchase trends or unexpected shifts in user behavior. By providing a clear picture of in-app financial performance, the report informs data-driven decisions that support continuous improvement in product development, marketing tactics, and customer engagement strategies.
Key Insights from In-App Purchase Reports
Take a concrete case: a small games developer in Cork notices that over a 5,000 EUR revenue period, roughly 50% of in-app revenue comes from just 10% of active users. This “power-user” trend is common, emphasising the value of granular user segmentation. By identifying these top spenders and targeting them with exclusive offers or loyalty perks, businesses can solidify this revenue stream while also seeking to increase lower-tier spending through more accessible pricing bundles.
Analysing purchase reports reveals when spending typically peaks—often soon after initial installation or during special promotions. For many businesses, the most lucrative time may be the first two weeks after a new user signs up. Optimising the placement and timing of limited-time offers or discounts in these high-engagement windows can enhance total revenue, avoiding the common pitfall of waiting too long to encourage a first in-app transaction.
- User spending is heavily concentrated among a small subset of highly engaged customers
- Most in-app transactions occur within the first few weeks of app use
- Average transaction value is often higher during special events or promotional periods
- Timely prompts and targeted offers increase conversion rates on in-app purchases
- Segmentation helps identify not just top spenders, but also churn risks within lower tiers
Analysing User Behaviour and Purchase Trends
Look at the numbers: imagine a new app in the Irish market tracking user actions over a sample of 7,200 purchases in a typical month. Analysis reveals most users make their first buy within four days of installation, but 60% are small, under €5, upgrades or extras. Further, high-value purchases come later, often after a user has engaged with the app at least ten separate times. This suggests initial offers should be accessible, while bigger bundles or premium features are better pitched after users have built a habit.
Understanding these trends allows marketers to split audiences for targeted campaigns. New users might respond best to discounts or starter packs, while regular, engaged users could be more receptive to personalised bundles or loyalty rewards. However, it’s easy to misread spikes in in-app purchases without context. High spending over weekends, for instance, may just reflect more leisure time, not a sustainable pattern. Looking for cohort trends—such as users who convert repeatedly versus those who lapse—helps avoid overestimating revenue potential from one-off events.
- Track when users make their first and largest in-app purchases
- Segment frequent buyers from occasional ones for tailored offers
- Monitor purchase timing to spot daily, weekly, or seasonal patterns
- Assess how feature releases impact purchase behaviour over time
- Identify churn points where users stop spending or uninstall apps
- Test the effect of introductory offers versus regular pricing strategies
Utilising Metrics for Revenue Optimisation
Effective use of metrics can transform how businesses drive mobile app income. Keeping a close watch on indicators such as average revenue per user (ARPU), conversion rate, and lifetime value (LTV) allows for smarter, data-backed decisions. By focusing on these data points, marketers can identify bottlenecks and opportunities, ensuring that every campaign or product update works harder to increase revenue.
Look at ARPU to gauge income trends. For instance, if an app generates EUR 5,000 over five months from 1,200 users, the ARPU amounts to just over EUR 4 per user. This insight can flag underperformance and help refine strategies that segment high-value users or tweak pricing models. Tracking ARPU alongside user engagement helps spot valuable behaviours ripe for scaling.
Pitfalls to watch out for include incomplete data and over-reliance on one metric. Always balance quantitative indicators with qualitative feedback to avoid misinterpretation. Focusing only on downloads and ignoring churn or retention will paint an unrealistic picture of long-term revenue potential.
- Monitor ARPU monthly to spot revenue patterns and seasonality
- Measure conversion rates for each in-app purchase offer to optimise messaging
- Track retention to tie marketing activity to revenue consistency
- Segment users by purchasing behaviour for more targeted campaigns
- Calculate LTV and adjust user acquisition spend accordingly
- Regularly review and update metrics as the app and its market evolve
Common Challenges and Pitfalls in Reporting
Run the maths on this: suppose an app generates €6,500 revenue from in-app purchases over a six-month period. If refunds and chargebacks amount to €900 in that window, failing to account for these adjustments can overstate profit by nearly 14%. This example highlights how overlooking post-purchase activity quickly leads to skewed reporting.
Another issue arises when sample periods are too short to reflect user behaviour. Analysing a single month’s purchases in isolation may not reveal longer-term trends or the impact of seasonal campaigns. Furthermore, inconsistent attribution rules—such as switching between first-click and last-click attribution—can make it difficult to compare reports or measure true campaign effectiveness.
- Always include refunds and chargebacks when summarising net revenue
- Standardise attribution models across all reporting periods
- Use periods long enough to capture seasonal variation or promotional spikes
- Double-check for duplicate purchase entries and data syncing errors
- Segment users by cohort to avoid misreading short-term anomalies
- Clarify definitions for all metrics and ensure team-wide understanding
Frequently Asked Questions about In-App Purchase Analysis
Here is a simple example: Suppose an app developer records 8,000 monthly purchases, spread over 7 months. To assess trends and user loyalty, they might compare repeat purchase rates across each month and look for spikes or drops that signal changes in user engagement. If the number of repeat buyers increases steadily while total spend stays stable, it could indicate loyal users are spending less per transaction. Conversely, sudden dips could point to bugs, pricing issues or lost interest after an update.
When analysing in-app purchase data, be wary of irregular data inputs or sudden spikes. These might result from promotion periods, unreported refunds or even fraudulent activity. Always cross-check figures with multiple sources. Failing to control for external factors can lead to misleading conclusions, with strategies targeting false positives instead of genuine opportunities for growth.
- Always segment users by acquisition source for clearer insights
- Track both the number and value of purchases to spot different trends
- Watch out for outliers caused by major campaigns or technical glitches
- Compare new versus returning customer spending habits
- Calculate purchase frequency over time to signal engagement levels
- Apply cohort analysis to understand changes in purchasing behaviour