
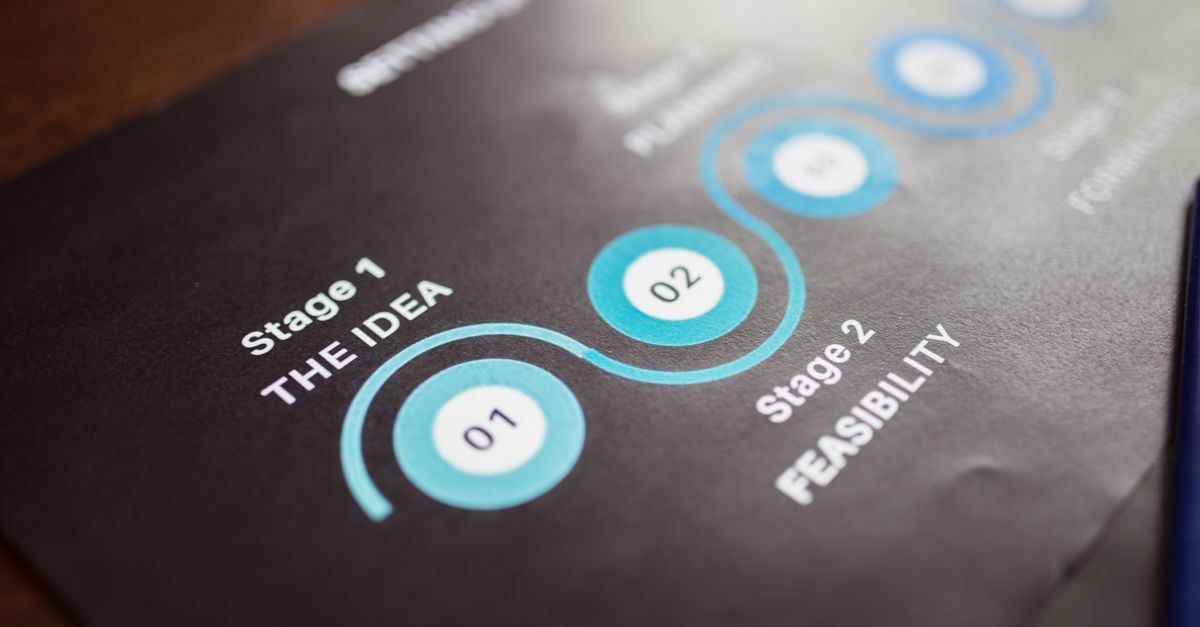
Timeline: Visual representation of project milestones

Close-up image of a business strategy chart on paper showing stages and feasibility.

A timeline is a visual representation of a sequence of events, tasks, or milestones arranged in chronological order. It serves as a planning and communication tool that helps individuals and organizations track how projects or historical events unfold over time. Timelines are widely used across various fields—from project management and event coordination to educational presentations and historical documentation.

By presenting events in a clear, linear format, timelines provide valuable context and reveal dependencies between tasks or occurrences. They enable teams to plan strategically, set realistic deadlines, and monitor progress throughout a project’s lifecycle. This visual clarity proves particularly useful in complex initiatives where multiple activities must be coordinated to achieve overarching objectives.

Beyond project management, timelines serve as powerful storytelling tools that can illustrate trends and patterns. Their versatility makes them equally valuable for business strategy and creative endeavors. Whether used for organizational planning or narrative construction, timelines bring structure to ideas and events, enhancing comprehension and communication effectiveness.

Benefits and Uses of Timelines

Take a concrete case: a web design agency in Galway plans a six-step website build over 6,000 tasks for a medium-sized retailer. By creating a visual timeline, they map out key milestones, such as wireframe approval, content delivery, and launch. This clear structure helps the agency break a seemingly overwhelming project into manageable phases, making progress feel measurable and reducing confusion.

Timelines not only provide visibility but also improve accountability. When stakeholders see upcoming deadlines and completed steps, they are better equipped to allocate resources and anticipate bottlenecks before they cause delays. Tracking each stage ensures the team stays on course and priorities are less likely to drift. If any risk emerges, the timeline highlights its impact, allowing fast corrective action.

  • Clearly identifies each project milestone for all team members
  • Enables proactive adjustment of resources and schedules
  • Highlights dependencies between tasks to avoid oversights
  • Improves transparency and communication amongst stakeholders
  • Simplifies progress tracking and reporting
  • Reduces risk of missed deadlines or forgotten deliverables

Visual Examples of Project Timelines

Look at the numbers: Imagine a project running across six key phases over the course of 6,000 hours—roughly what you’d expect for a medium-sized website build involving several teams. To make progress visible, the timeline design might take the form of a horizontal bar with dated milestones plotted at regular intervals. Each milestone—such as ‘design complete’, ‘content upload’, or ‘testing’—stands as a clearly labelled checkpoint along the path, helping teams visualise both progress and upcoming work.

Gantt charts are also popular for this purpose, visually stacking overlapping tasks in layers so dependencies are instantly obvious. If your marketing team is developing a new campaign and the copywriting must finish before the graphics can go to review, the Gantt view immediately flags this handover. Simple timeline visuals suit campaigns with linear, phase-based tasks, while more complex projects benefit from layered or swim-lane visuals.

  • Horizontal bar timelines are effective for simple, sequential projects
  • Flag milestones with clear labels and dates for easy team reference
  • Gantt charts reveal dependencies and overlapping tasks at a glance
  • Timelines in a dashboard can send alerts as critical milestones approach
  • Visual clutter reduces clarity—use colour and spacing to distinguish phases
  • Keep formats consistent across teams to reduce confusion over project status

Common Mistakes in Timeline Creation

One of the most common mistakes in timeline creation is underestimating the duration of each project phase. Teams often overlook dependencies, which can cause significant delays when tasks that are assumed to run in parallel actually depend on the completion of previous stages. Overloading the schedule with too many tasks at once can also lead to resource conflicts and rushed work, ultimately compromising quality.

Another pitfall is failing to allow for unforeseen obstacles or last-minute changes. Without a degree of flexibility, timelines become rigid and unrealistic. For example, if a marketing team in Galway plans a campaign with 8,400 tasks over eight months (1,200 tasks x (3+4)), any slip in one stage creates a domino effect, impacting every subsequent deadline. Building in buffer time and regular review sessions can prevent projects from derailing because of unexpected challenges.

  • Overlooking task dependencies causes bottlenecks later on
  • Assuming best-case scenarios without factoring in delays
  • Not updating the timeline as the project evolves
  • Scheduling too many simultaneous tasks for available resources
  • Ignoring holidays or planned leave in resource allocation
  • Failing to communicate timeline changes to all stakeholders

Timelines Versus Other Project Planning Tools

Run the maths on this: A software firm is coordinating a 6,000 task rollout across departments, with dependencies stretching over 8 months. Choosing between project tools, they must decide if a timeline view alone suffices or if more complex tools are needed for team workload balance, budgeting, and risk controls. With hundreds of moving parts, a timeline can quickly flag conflicts and deadline clashes, but lacks the depth of Gantt charts or Kanban boards for managing shifting priorities or resource allocation.

The main difference is clarity versus detail. Timelines are ideal for visualising project milestones and sequences at a glance. However, as soon as projects grow in complexity or size, tools offering task assignment, progress tracking, and bottleneck identification add real value. Using the right combination can keep teams on track while maintaining control over budget and delivery dates.

Tool typeWhat to checkRisk or note
TimelineKey milestones and deadlinesMay miss resource or task dependencies
Gantt ChartTask sequences and durationsCan become hard to read for large teams
Kanban BoardTask progress and prioritiesMay obscure overall timeframes
SpreadsheetData flexibilityEasily becomes disorganised

For mid-sized teams or straightforward objectives, timelines make project status updates easy. For complex launches, supplementing with a more structured tool allows managers to spot and resolve hidden issues before they impact delivery.

👉 See the definition in Polish: Timeline: Oś czasu projektów i działań marketingowych

Related terms

Browse all terms in our Digital Marketing Glossary

Leave a comment